Video News
User login
Who's online
There are currently 0 users online.
Sponsored by

![]()
Associated with

Mean Precipitation and Temperature
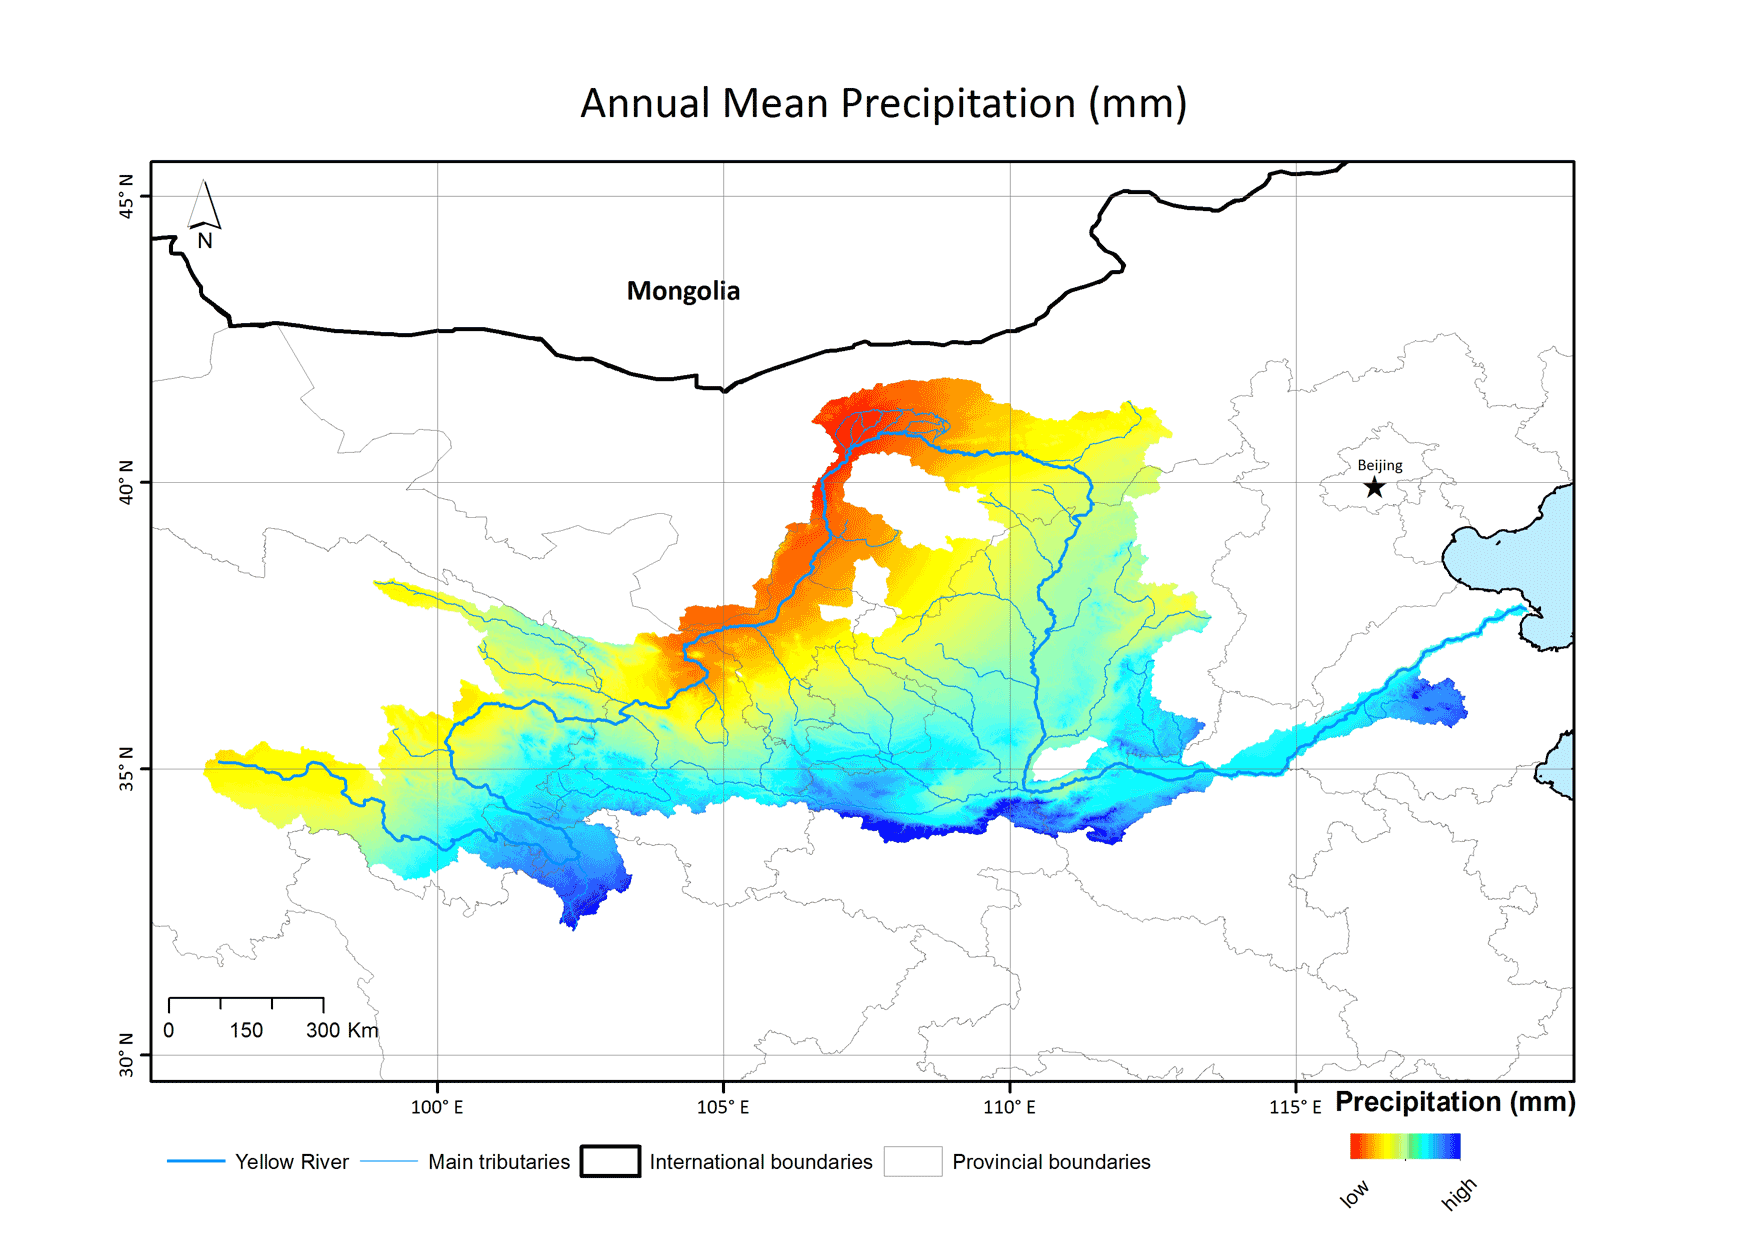
Map Precipitation:
This map depicts the precipitation distribution within the Yellow River Basin. The rainfall is unevenly distributed in space and time. It shows a decreasing trend from southeast to northwest and is mainly concentrated from July to September. The basin´s mean annual precipitation is around 520 mm. The lowest precipitation values can be found in Ningxia/Inner Mongolia plains and the Gobi desert, the highest in the lower reaches of the Yellow River.
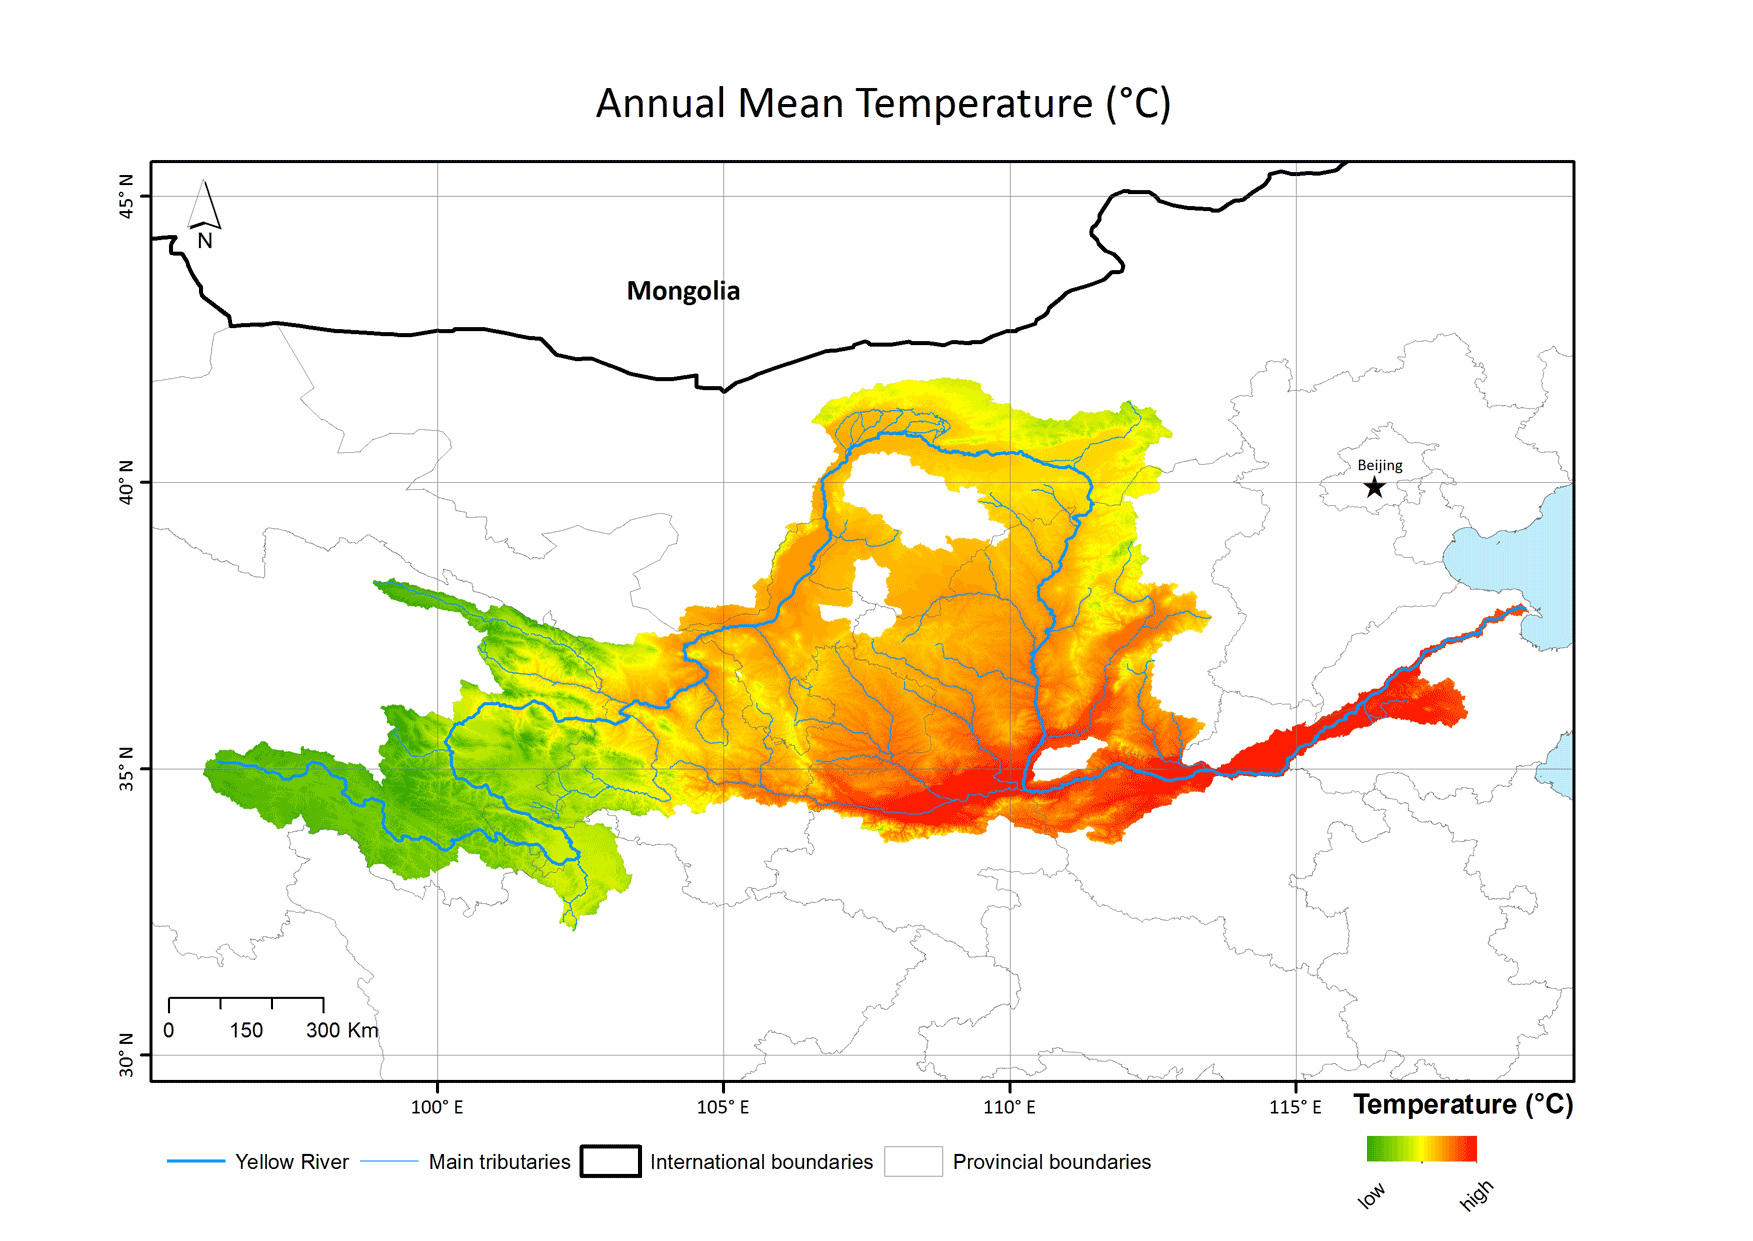
Map Temperature:
The annual mean temperature of the Yellow River Basin is highlighted in this map. Likewise the precipitation, a clear gradient from west to east can be observed, with low values on the Qinghai-Tibet Plateau and relatively high values on the North China Plain near the coast.