Video News
User login
Who's online
There are currently 0 users online.
Sponsored by

![]()
Associated with

Water quality parameters in the Bohai Sea
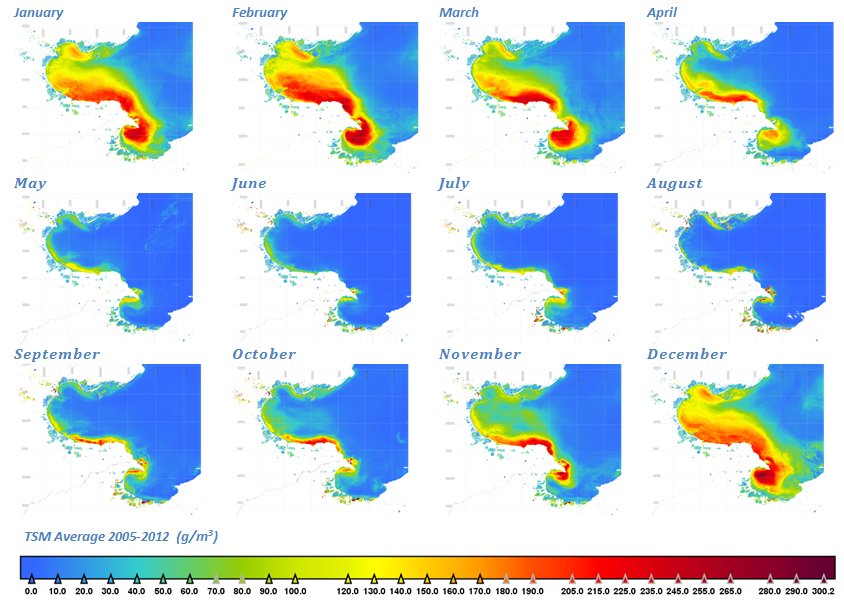
The Yellow River discharges into the Bohai Sea, which is located in the northern part of the east coast of China, with an area of 7.8 x 10⁴ km2. This sea is a semi-enclosed basin with four main parts: the Liaodong Bay up in the North, the Bohai Bay in the West, the Central Bohai Sea and the Laizhou Bay in the Southeast. The Bohai Strait separates the Bohai Sea from the Yellow Sea. The Bohai Sea is quite shallow, with an average depth of 18m. River discharge, re-suspension and exchange with water masses of the Yellow Sea determine the spatial distribution of suspended matter and chlorophyll concentrations of the Bohai Sea (Jiang et al., 2004). The seasonal variations are high, and the wind plays a major role, through the wind waves, in the pattern and concentration of water quality parameters.
Satellite ocean-colour remote sensing provides synoptic information of the Bohai Sea on regional or local scales. MERIS data are used in this project, providing information on medium resolution (300 m pixel) of several water quality parameters using a specific ocean colour algorithm implemented for coastal high turbid waters. This algorithm is based on the Coast Colour (CC) project research and provides information about phytoplankton chlorophyll_a concentration, total suspended matter concentration, yellow substanceturbidity and Secchi depth, besides inherent optical properties (absorption and backscattering of different parameters), in a period of 8 years, from January 2005 to April 2012. Together with MERIS, research on the use of other sensors for this area is taking place (GOCI, Landsat 8, VIIRS). Validation and assessment of the accuracy of the different water quality parameters will be done if in situ data becomes available.
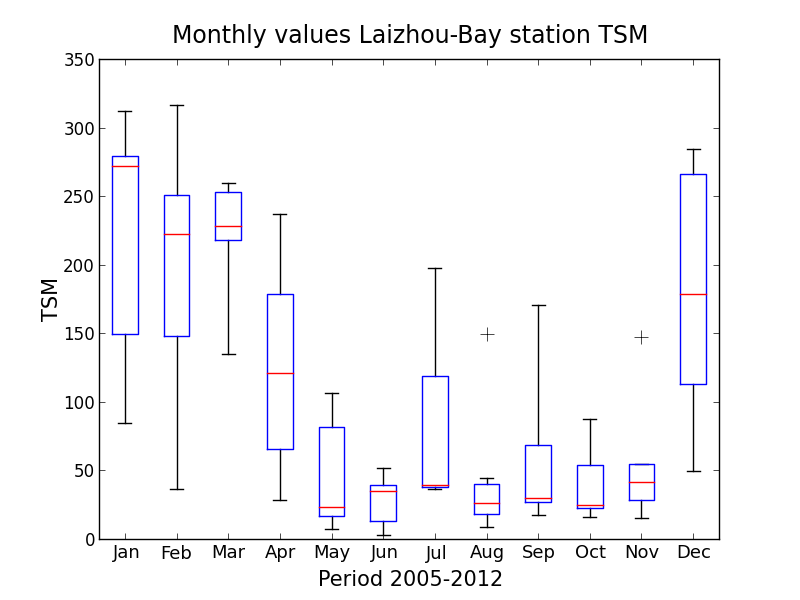
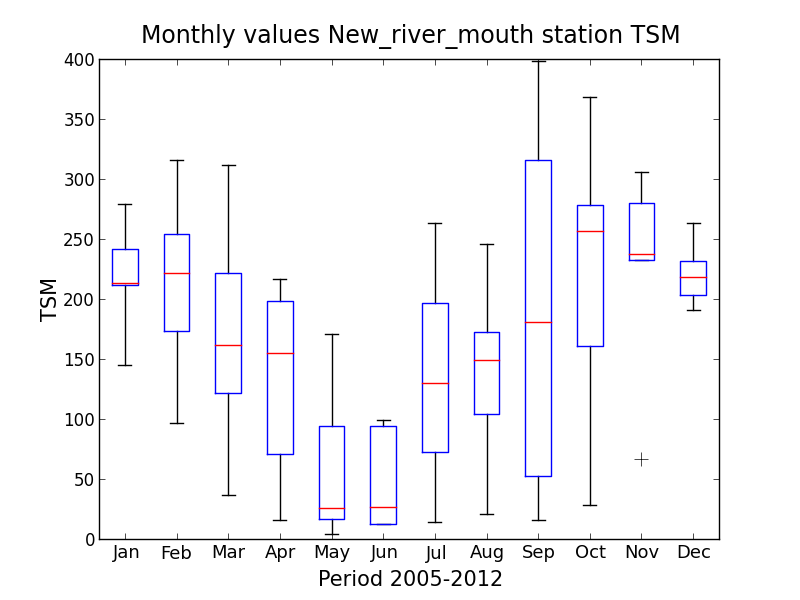
Some demonstration products and time series analysis using MERIS data are shown in Figures 1 and 2. Figure 1 shows the monthly average for the whole period of the total suspended matter concentration calculated using the CC algorithm. A seasonal and spatial pattern is clearly observed and it will be analysed in detail in the reports of the project. Some statistical analysis is also done, and time series plots derived in different areas of the basin to understand the behaviour and trend of the WQ parameters (Figure 2).