Video News
User login
Who's online
There are currently 0 users online.
Sponsored by

![]()
Associated with

Alleviating Data Limitations in Coastal Flood Hazard Analysis: Reconstruction of Storm Surge Events by Meteorological Proxies
Surge-associated flooding has been a problem of key-importance for many areas around the world - see for example the catastrophic flood in the North Sea in 1953 (especially in the Netherlands). The Yellow River Delta in China, known for its floods and early flood-protection works, has witnessed an intense economical development over the past three decades. This development includes the extension of the Shengli oil field and urbanized areas in areas prone to storm surges. However, an encompassing hazard analysis for this Yellow river Delta does not exist. Thus the work of GFZ within DELIGHT aims at a multivariate probabilistic flood hazard analysis based on extreme value statistics for the Yellow River Delta.
For this type of study a very good data base of data is required: long (spanning several decades) and complete time series of high-frequency tide gauge data, preferably from various stations around the location of interest, possibly barometric data etc. However, available tidal data close to the Yellow River Delta are limited, typically not allowing for a statistical hazard analysis. Until today only one longer time series at the eastern side of the Bohai Sea (location Dalian-Laohutan), is available, while a 10-year-long hourly time series at the place of interest is also expected to be available soon.
Scarcity and availability of data is a very common problem in flood hazard analysis. In our case to overcome this problem we chose a statistical approach to reconstruct past extreme sea-level events at the Yellow River Estuary based on combination of tide-gauge with meteorological data. This is a challenging task because coastal flooding is a multi-parametric and poorly understood problem in many areas. Our analysis is based on the evidence that significant surges leading to flooding correlate with wind fields and barometric pressures below a certain threshold. Still, the details of this process are not known, mainly because of the scarcity of data in flood-vulnerable areas in various parts of the world.
In order to solve this problem, we develop a new methodology, the aim of which is to identify causative correlations hidden in multi-parametric data. This methodology consists of three axes:
- A combined peak-over-threshold analysis of surge time series and meteorological components, and
- Analysis of pressure-wind fields at the Bohai Sea area, combined with a principal component analysis.
- After a storm surge model is developed based on this components for Dalian-Laohutan a validation is planned using other stations worldwide.
The station chosen to be examined first was the Dalian-Laohutan station, which is the closest to the area of interest. A harmonic analysis was chosen among many methods (wavelets, Fast Fourier Transform, filter application) in order to remove the deterministic tidal signal from the total water level time series and to obtain the stochastic storm surge time series, which is the residual of the time series after the harmonic analysis. The meteorological data for the larger Bohai sea were extracted from the global reanalysis dataset ERA-Interim. An optimization procedure is used to derive thresholds above which storm surge time series and wind speed or atmospheric pressure correlate best. The wind direction is also expected to be used as a constraint. These thresholds may be very useful because they can give the boundaries of a possible reconstruction of surge time series. An example of double peak-over-threshold correlation between surge and pressure time series can be seen in Fig. 1. A significant negative correlation coefficient (|r| >0.5) can be identified for a storm surge threshold >2.4m. 
Figure 1. Correlation coefficient for values of storm surges and of atmospheric pressure simultaneously exceeding a certain threshold. Preliminary results. Increase of correlations is likely to indicate a causative relationship.
The second direction of our methodology is the spatio-temporal analysis of wind and pressure fields over the Bohai sea area in order to recognize patterns of the meteorological components that can lead to extreme surge events. For this reason the 20 maximum positive surge events have been selected and the meteorological fields spanning a time period of some days before and after maximum surge heights are analyzed. These fields seem to follow some patterns (see Fig. 2), so a principal component analysis has been designed in order to reveal these patterns more clearly. 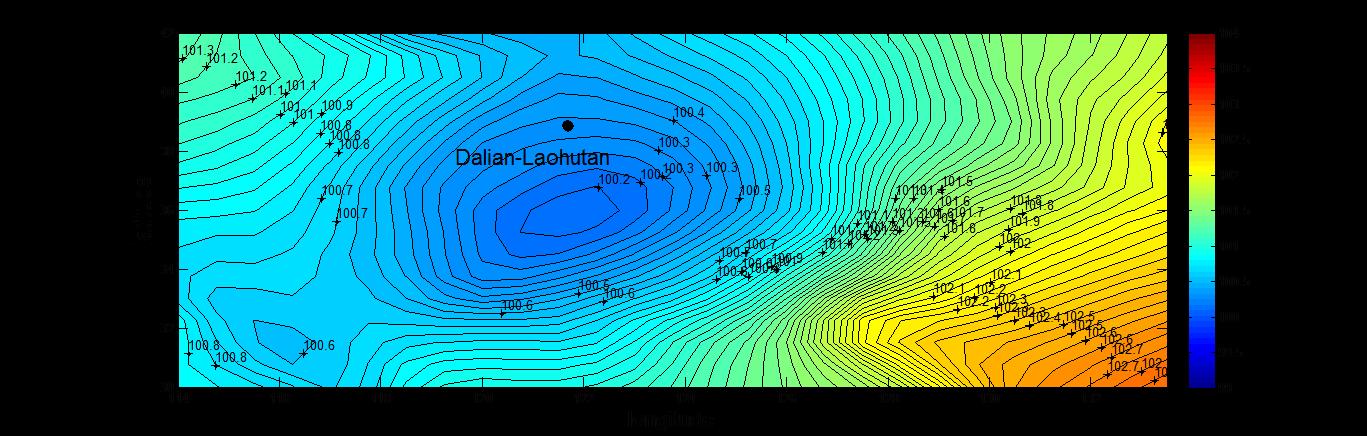
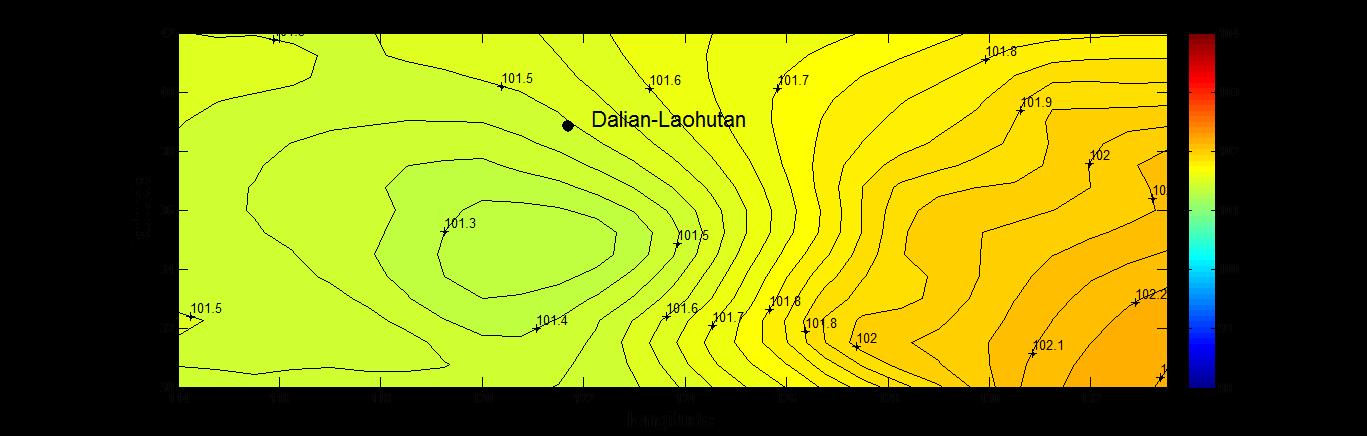
Figure 2. (Top) Pressure field over the Bohai sea area three hours prior to maximum observed storm surge of the period 1980-1989 at the Dalian-laohutan location. (Bottom) For the same area and time period (1980-1989) mean pressure fields exactly before the 20 maximum storm surges. A systematic pattern in the pressure field seems to characterize major positive surges.
The first results are encouraging, thus this approach will be continued to reconstruct storm surge events in the past, on which the hazard analysis will be finally based. If a statistical relationship between surges and meteorological components is found in the Dalian-Laohutan location, a validation procedure for this relationship has been designed using a sample of 10 stations around the world with same characteristics with the Yellow River Estuary area (latitude, fetch, bathymetry). Then a reconstruction of past extreme events in the Yellow River Delta area is possible, based on this statistical relationship.
Results from the above analysis are expected to be very useful not only for the Yellow River Estuary, but also for many areas facing similar problems of data scarcity.