Video News
User login
Who's online
There are currently 0 users online.
Sponsored by

![]()
Associated with

Observation of water surface dynamics
The water coverage of the Yellow River Delta was observed since 2005 using SAR satellite imagery. Water surface maps, so-called "watermasks" were processed from SAR data and combined to inundation frequency maps for single years. The colors in Fig. 1 and Fig. 2 display the number of observations used for the inundation frequency map - blue indicates temporarly to permanently inundated areas, whereas red indicates that this part was covered by water only once (orange twice, yellow 3 times).
The ASAR sensor on ENVISAT satellite was used to process historical data (Fig.1). Figure 1 displays the dynamics detected during the years 2005, 2008, 2009, and 2011. This satellite is not producing new data anymore since 2012. Since the year 2013 TerraSAR-X and since 2014 additionally Sentinel-1A data are used to monitor changes of the water surface in the coastal region of the Yellow River Delta. Fig. 2 displays the inundation frequency of the Yellow River Delta for 2013 and 2014 derived from TerraSAR-X data, as well as a detailed view of the Yellow River mouth.
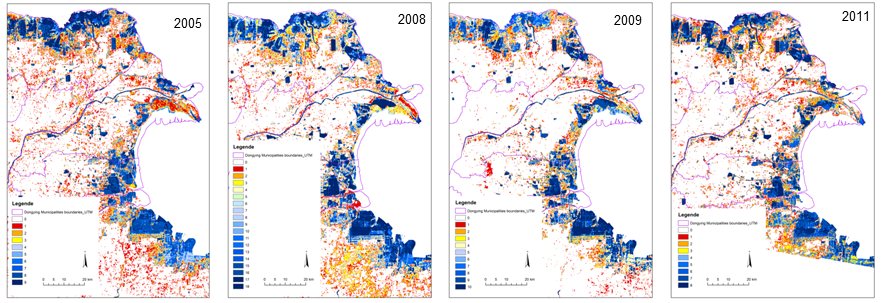
Fig.1: Observed water surface dynamics in Dongying District between 2005 and 2011 - See the inundation frequency maps for the years 2005, 2008, 2009, and 2011 derived from ASAR wide swath mode data.
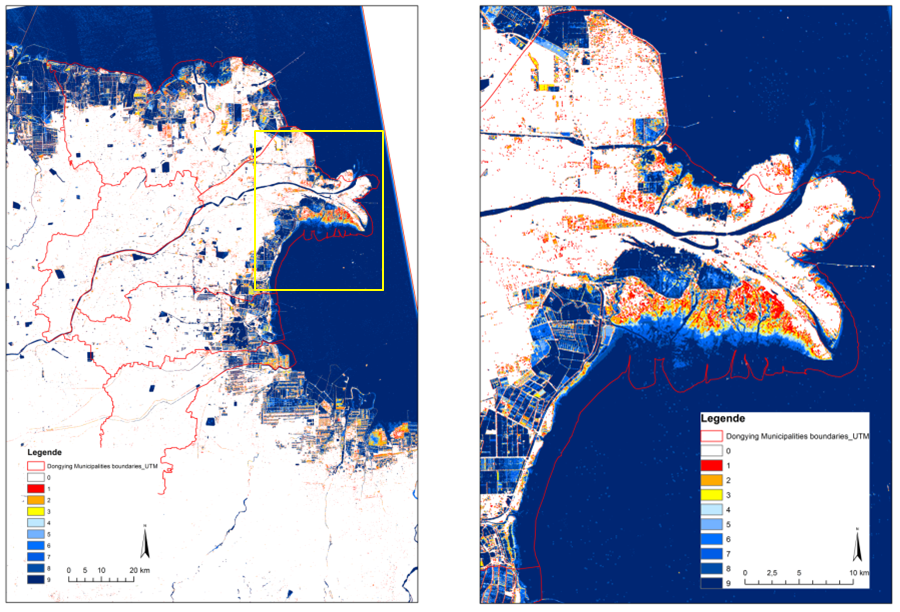
Fig.2: Observed water surface dynamics in Dongying District between 2013 and 2014 derived from TerraSAR-X widescan data (Source: Kuenzer et al 2015).