Video News
User login
Who's online
There are currently 0 users online.
Sponsored by

![]()
Associated with

Vulnerabilty Assessment - Analyses of field work and questionnaires
The questionnaires were conducted to gain insight regarding to how pollution events, flooding events, erosion, and salinization affect the local population and their livelihood. Below, the results of several questions are presented. Most of the people interviewed farmed more than one crop. Farmers that farmed a crop were often also involved in livestock or aquaculture activities. With this definition, 70 people were involved in agricultural activities.
Floods, droughts, and salinity intrusion are hazards that threaten the local population, their livelihoods, and their property. Regarding the question whether these 70 interviewees were affected by drought events, 53% answered with Sometimes, 32% answered Never and 15% did not provide an answer - see Figure 1. Regarding the question whether these 70 interviewees were affected by salinity of the soils and water, 70% answered yes, 14% with no, and 15% did not provide an answer - see Figure 2. Regarding the question whether all interviewees were affected by floods, 67% answered with No (never), while 33% answered Yes - see Figure 3. The origin of floods has also been subject of the questionnaire: 21% of the 28 interviewees that have answered that they are affected by floods in the previous question, have replied that flood waters originate from the sea (e.g. storm surge, or land subsidence), 17% from the river, and 62% from precipitation - see Figure 4.
During this field work, 92 in-depth interviews, with each 50 questions pertaining to social status, education level, livelihood, hazards exposed to, and personal opinions of vulnerability, were conducted among the rural population. The analyses will be subject of a publication that is currently under preparation.
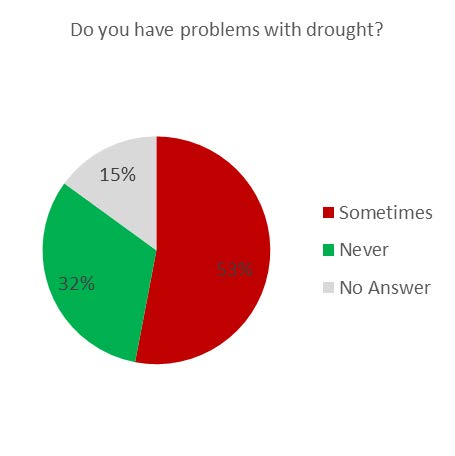
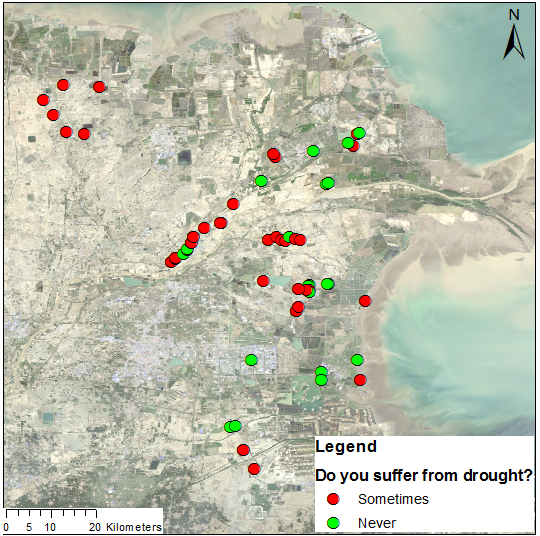
Fig.1: Left: Results in a pie chart regarding to what extend farmers are experiencing drought. Right: The location of these respondents (publication in preparation).
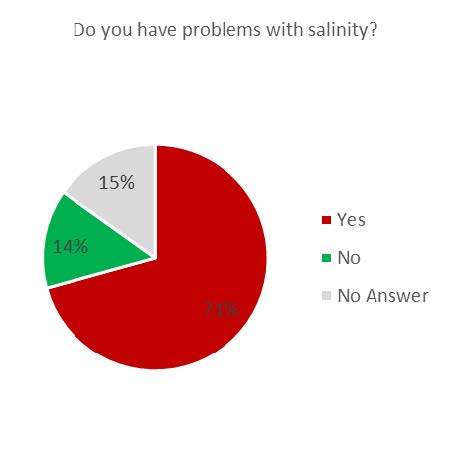
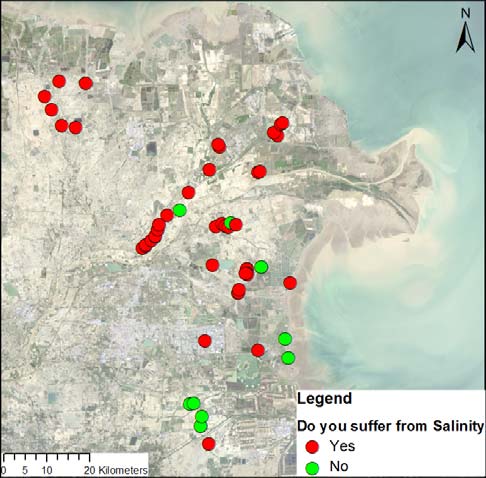
Fig.2: Left: Results in a pie chart regarding to what extent the local farmers are affected by salinization. Right: The location of these respondents (publication in preparation).
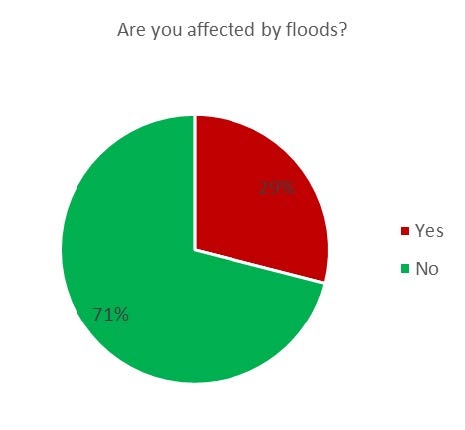
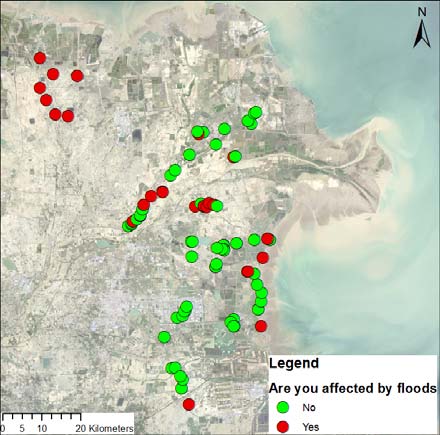
Fig.3: Left: Results in a pie chart regarding to what extent the local population is affected by flooding events. Right: The location of these respondents (publication in preparation).
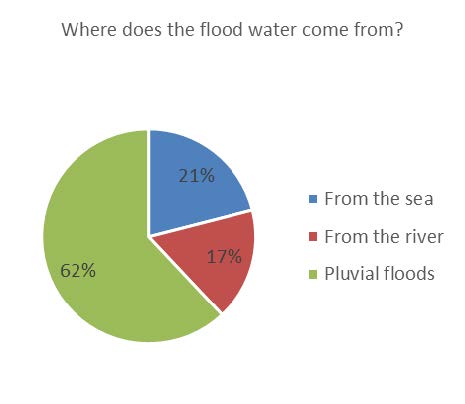
Fig.4: Results in a pie chart regarding to what the origin is of flood water. (publication in preparation).