Video News
User login
Who's online
There are currently 0 users online.
Sponsored by

![]()
Associated with

12-year analysis of basin-wide NDVI changes based on EO data, 2002-2014
Based on a MODIS NDVI time series, the annual NDVI sums have been calculated since 2002 with a spatial resolution of 250 m. The Normalized Differenced Vegetation Index (NDVI) is an often used proxy, describing the prevailing productivity and vegetation density. In order to identify NDVI changes during the last decade, we performed a trend analysis using the annual NDVI sums. The statistically significant trends are depicted in the following figure, showing large areas with positive NDVI changes.
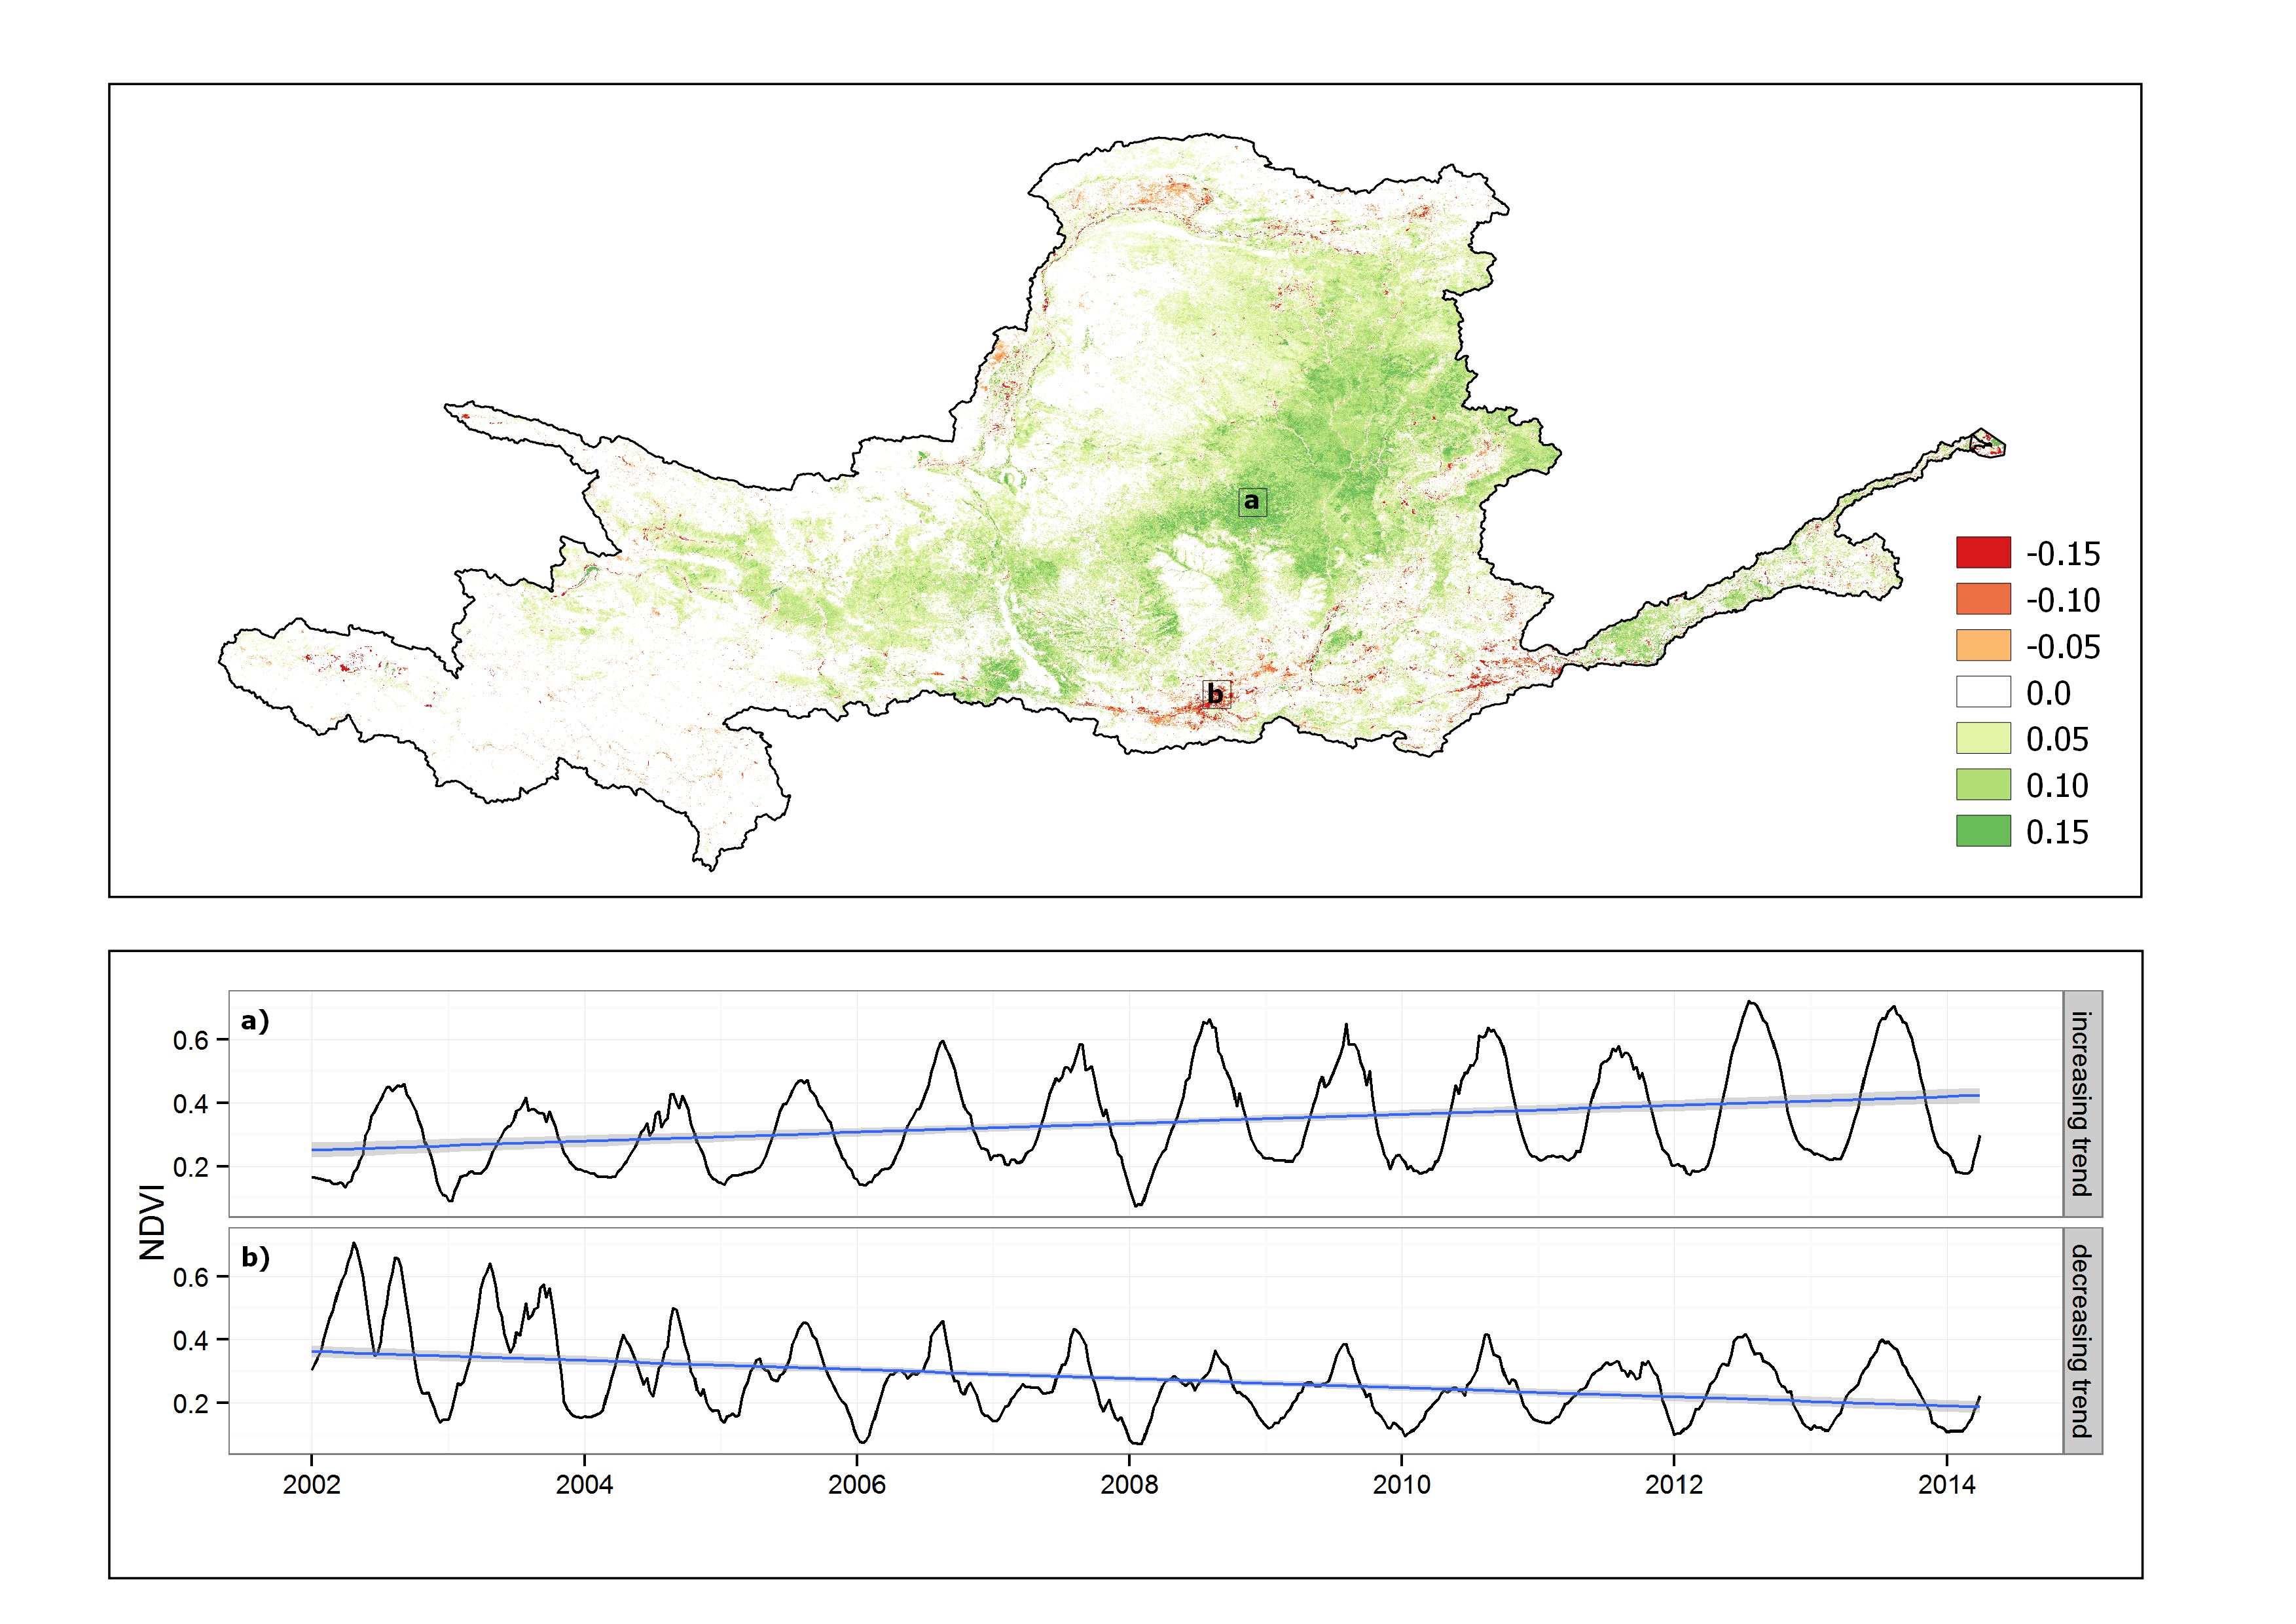
Fig.1:Significant NDVI changes (top) between 2002 and 2014 based on MODIS data. Positive trends are shown in green colour; negative trends in red. The bottom image highlights the NDVI time series of two exemplary areas with contrary trends. (publication in preparation)