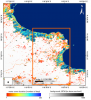
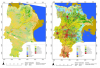
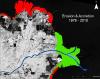
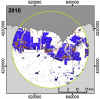
The water coverage of the Yellow River Delta was observed since 2005 using SAR satellite imagery. Water surface maps, so-called "watermasks" were processed from SAR data and combined to inundation frequency maps for single years. The colors in Fig. 1 and Fig. 2 display the number of observations used for the inundation frequency map - blue indicates temporarly to permanently inundated areas, whereas red indicates that this part was covered by water only once (orange twice, yellow 3 times).